
|
|
|
|
|
|
|
|
|
|
|
|
|
|
|
|
|
|
|
|
| |
 | |
| IFA ROE |
Pixel Units in the H-alpha survey
For the SHS there is a choice of pixel units when extracting image data. The choices are:- Transmission (Black stars on grey background)
- Intensity (White stars on black background)
- Density (White stars on black background)
Pixel values in transmission units are related to incident intensity via the
established transmission (T), Density (D) and Intensity (I) relationships from the straight line
portion of the log-linear photographic characteristic curve. i.e.
where gamma is the gradient of the response on the linear region of the D-Log10(I) plane.
A typical tech-pan characteristic curve
obtained through the standard broad-band OG590 filter is shown
here as measured photographic density vs log10(I).
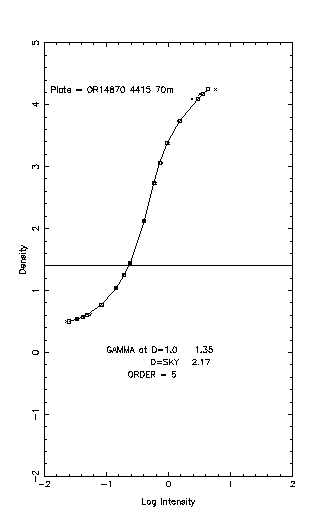
In the SHS all pixel units are floating point real*4. This compares with the SSS where pixel units are Integer*2 values in density space but scaled (on a field by field basis) to lie in the range 0-32767. Real*4 values are used for the SHS as they offer greater accuracy and flexibility. For example they are amenable to transformation to real flux units (e.g. to Rayleighs) via suitable calibration sources. Also application of the H-alpha flat-field will not result in data going out of range as it possibly could do for 2-byte (signed) integers.
Below we give brief explanations for each unit and partial extracts from the fits headers of extracted fits images of the same 15x15arcmin region centred on a Planetary Nebula at 08 03 12.4 -33 31 01 (J2000) from the SHS data which shows the key sections concerning the pixel units for each choice. At the bottom the equivalent section from the fitsheader of the same region extracted from the R-band of the SSS is also shown for comparison.
A) Pixel Units: TRANSMISSION
Basically a measure of transmitted light through the photographic
emulsion as determined by SuperCOSMOS. Hence dark areas of the exposure (developed images) have low
transmission values and lighter areas (sky background) have large
values so the fits images appear as negatives with dark stars on a grey background, just like the
photographic exposures themselves. It is the log of the reciprocal of the measured transmission values that is
directly proportional to the photographic density.
DATATYPE= 'REAL*4  '           / Type of data
DATUNITS= 'TRANSMISSION'       / Units: transmission, density or intensity
XPIXELSZ=   9.997114974000E+00 / [microns] X pixel size
YPIXELSZ=   1.000000000000E+01 / [microns] Y pixel size
OBJCTRA = '  8  3 12.398'      / Centre Right Ascension (J2000)
OBJCTDEC= '-33 31  0.93'       / Centre Declination (J2000)
OBJCTX  =   6.831369255326E+03 / [pixels] Centre X on plate
OBJCTY  =   6.784975815772E+03 / [pixels] Centre Y on plate
DATAMINI=         3.500000E+01 / [DATUNITS] Minimum pixel value
DATAMAXI=         5.293000E+03 / [DATUNITS] Maximum pixel value
DATAMEDI=         3.883000E+03 / [DATUNITS] Median pixel value
DATAMODE=         3.964000E+03 / [DATUNITS] Modal pixel value
FLATFLD =                    F / Are the pixel data flat-fielded?
B) Pixel Units: INTENSITY
Intended to represent the brightness of images where high values equate to
high intensity i.e. bright images. Low values represent faint images and the background.
Thus the fits images are positives - white stars on a grey-black background. In UKST photography
the relationship between intensity (incident flux times exposure time) and measured photographic density
is derived from determination of the characteristic curve. This normally comes from measures of
step wedges impressed on the exposure at the same time as the photograph on the sky is obtained. Unfortunately,
for the H-alpha exposures the step wedge is located in a corner of the exposure well off the clear aperture of
the inteference filter. However a generic linearised fit has been found to give reasonable
transformation under normal exposure conditions for converting
measured SuperCOSMOS transmission values to nominal Intensity values
for both plates and films. A constant gamma (slope of straight line
portion of the characteristic curve) is used and it is assumed that
the sky background level is always on this straight line region.
DATATYPE= 'REAL*4  '           / Type of data
DATUNITS= 'INTENSITY'          / Units: transmission, density or intensity
XPIXELSZ=   9.997114974000E+00 / [microns] X pixel size
YPIXELSZ=   1.000000000000E+01 / [microns] Y pixel size
OBJCTRA = '  8  3 12.400'      / Centre Right Ascension (J2000)
OBJCTDEC= '-33 31  1.00'       / Centre Declination (J2000)
OBJCTX  =   6.831332729995E+03 / [pixels] Centre X on plate
OBJCTY  =   6.784876714616E+03 / [pixels] Centre Y on plate
DATAMINI=         2.703063E+03 / [DATUNITS] Minimum pixel value
DATAMAXI=         1.569084E+04 / [DATUNITS] Maximum pixel value
DATAMEDI=         2.967537E+03 / [DATUNITS] Median pixel value
DATAMODE=         2.949120E+03 / [DATUNITS] Modal pixel value
FLATFLD =                    F / Are the pixel data flat-fielded?
C) Pixel Units: DENSITY Photographic density (usually in the range 1-4) is related to Intensity via the characteristic curve. For SuperCOSMOS scans a generic `linearised' form is adopted when converting between Density (transmission) and Intensity where a fixed `reasonable' value for the slope of the straight line portion of the curve (gamma) is used.
DATATYPE= 'REAL*4  '           / Type of data
DATUNITS= 'DENSITY '           / Units: transmission, density or intensity
XPIXELSZ=   9.997114974000E+00 / [microns] X pixel size
YPIXELSZ=   1.000000000000E+01 / [microns] Y pixel size
OBJCTRA = '  8  3 12.400'      / Centre Right Ascension (J2000)
OBJCTDEC= '-33 31  1.00'       / Centre Declination (J2000)
OBJCTX  =   6.831332729995E+03 / [pixels] Centre X on plate
OBJCTY  =   6.784876714616E+03 / [pixels] Centre Y on plate
DATAMINI=         7.931138E-01 / [DATUNITS] Minimum pixel value
DATAMAXI=         3.339080E+00 / [DATUNITS] Maximum pixel value
DATAMEDI=         9.282468E-01 / [DATUNITS] Median pixel value
DATAMODE=         9.192346E-01 / [DATUNITS] Modal pixel value
FLATFLD =                    F / Are the pixel data flat-fielded?
END
D) Pixel Units for SSS images: DENSITY only The same PN region was extracted. Note pixel values are INTEGER*2 in the range 0-32767
DATATYPE= 'INTEGER*2'          / Type of data
DATUNITS= 'DENSITY '           / Units: transmission, density or intensity
XPIXELSZ=   9.997403000000E+00 / [microns] X pixel size
YPIXELSZ=   1.000000000000E+01 / [microns] Y pixel size
OBJCTRA = '  8  3 12.400'      / Centre Right Ascension (J2000)
OBJCTDEC= '-33 31  1.00'       / Centre Declination (J2000)
OBJCTX  =   1.465500341686E+04 / [pixels] Centre X on plate
OBJCTY  =   2.495197318687E+04 / [pixels] Centre Y on plate
END
No DATA min,max median or mode values are given in the fits header. However iraf imstat on this fits image reveals:
 imstat R66531.fits[0]
#               IMAGE      NPIX      MEAN    STDDEV       MIN       MAX
       R66531.fits[0]   1795600     6349.     2132.     2885.       23716.
The INTEGER*2 pixel density values for the SSS have been arbitrarily scaled to lie
in the range 0-32767 and are derived from the measured transmission.
Note also that the fits header for the H-alpha extractions also contains an entry concerning the application of a flat field. Further details concerning this option are given here. If the flat field option is chosen then a version of it appropriate for the pixel unit choice is automatically selected.
Home | Intro | Get an Image | Get a Catalogue
Coverage | Documentation | History | Links
WFAU, Institute for Astronomy,
Royal Observatory, Blackford Hill
Edinburgh, EH9 3HJ, UK
M.Read@roe.ac.uk
30/7/2008